

2020 was a tumultuous year for trucking. The pain was felt everywhere, by everyone; but data show the smallest fleets likely felt the impact of the pandemic the most in our sector. For a decade, smaller fleets grew rapidly, successfully attracting drivers that the big fleets couldn’t reach or, simply, couldn’t hold. In fact, in the past decade — even into early 2020 — small fleets (1-100 trucks) added drivers at nearly a 2:1 ratio versus fleets of 500+ trucks. But all that changed in 2020.
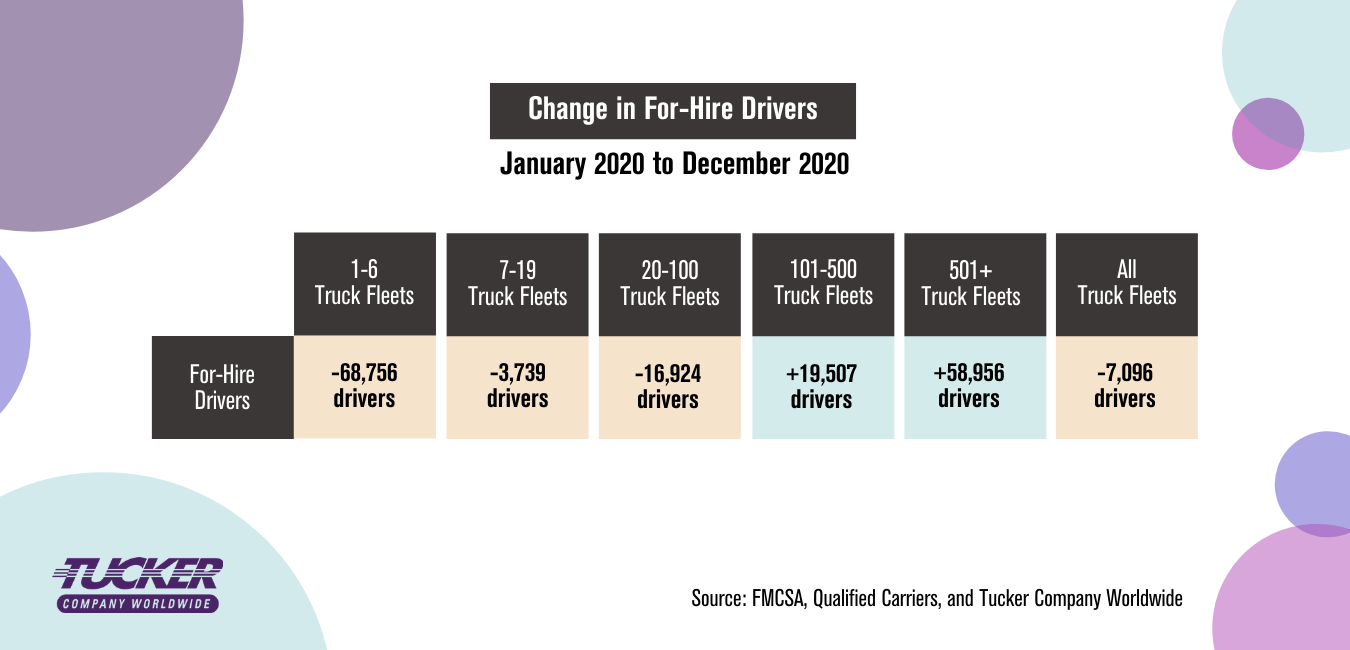
After reaching the highest number of drivers ever in early 2020, the pandemic wiped out 163,697 of them from the nation’s fleet. Most of those gains, as shown by FMCSA data in early 2020, have not returned. By year’s end, 2020 closed with 7,096 fewer drivers than the end of 2019, however, that’s still a 5.3% decline from the heights 2020 reached early on.
The strong close to 2020 saw the spot market return. The chart below is notable in that it’s the first year the U.S. driver count was a net negative. But take look at the shift of drivers from small to large fleets. The losses in the 1-100 group represent a modest 4.4% reduction from the beginning of the year. But the gains in the 101-500+ group represent a more significant relative gain for them. The larger fleets gained 7.1% net drivers; in turn, increasing the capacity to serve their customers. This is some of what’s behind the bullish feeling regarding transportation stocks. Rates are up, and the large, publicly traded carriers can actually haul more than they could in 2019.
But driver fortunes like these will be short-lived for large fleets the longer a recovery continues. It’s natural for drivers to seek shelter with large carriers until they feel like the spot market is back (and the spot market is back). But the inherent pioneering spirit of drivers, advances in technology, and affordable, abundantly available used trucks will make it easy to go back into business when combined with good rates.
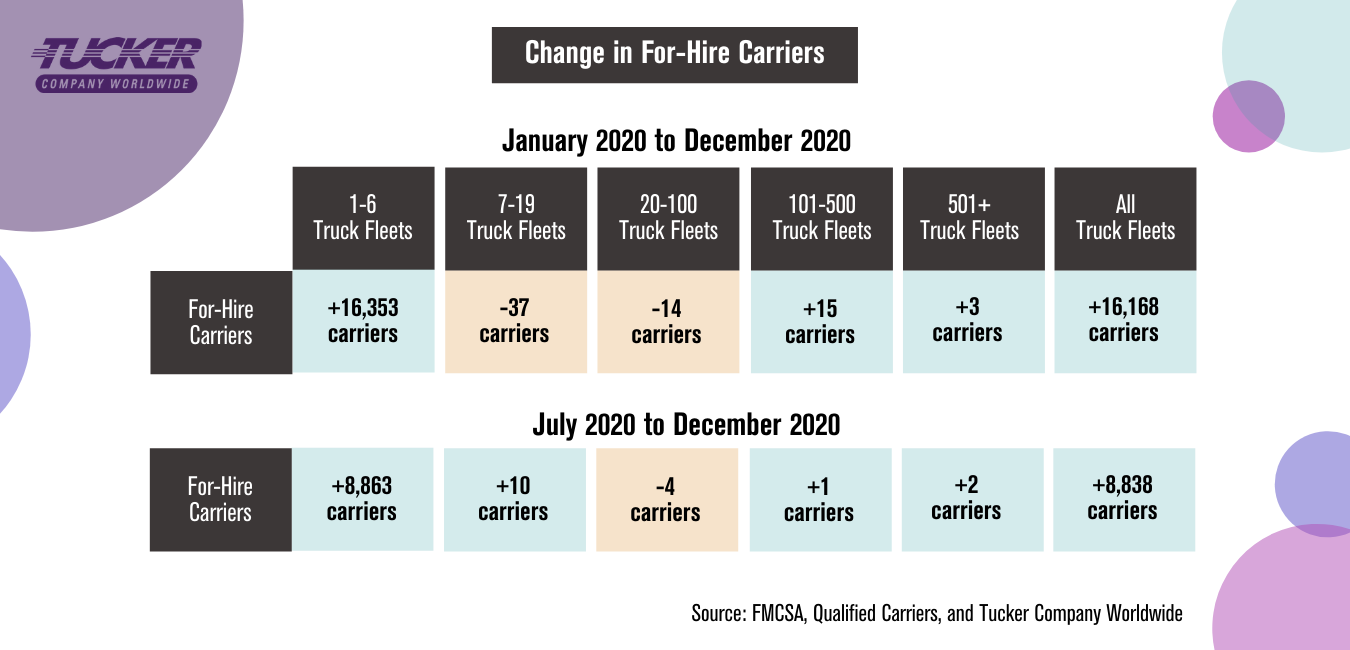
Reports of bankrupt carriers may be interesting, but it doesn’t give a read on the marketplace. The more relevant data from 2020 is that the U.S. minted both new carrier growth and overall net growth in for-hire trucking companies. The chart below shows that there were 16,168 overall net new carriers ending 2020, than there were in 2019. That’s a 6.3% increase in trucking companies in business! We have also included data starting from July 2020 to show that this growth has not only been steady, but it’s actually accelerating in the small fleet segments.
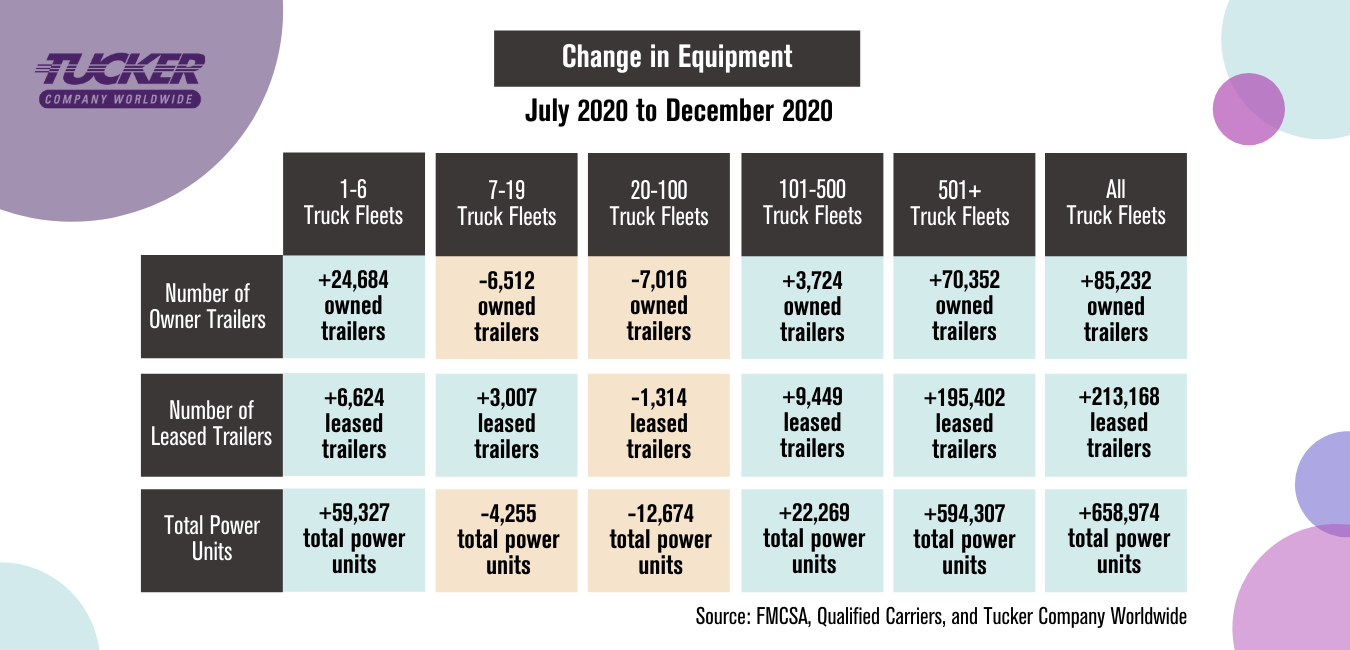
Another reason to be concerned that larger fleets won’t be able to hold their recently won drivers is the used truck market. Large fleets, flush in capital through a decade of economic growth, added new equipment. The chart below shows the nation added significant new, net growth to trailers and tractors in 2020. In fact, there are nearly 500,000 more tractors than drivers — a fact sure to drive down the price of used equipment and tempt company drivers to scratch that itch to go independent. That growth in power units is notable, in that it’s 23% higher than when 2019 ended. Finally, that middle-market carrier segment continues to struggle in drivers, carrier counts, and equipment.
As we prepare to close out 2020’s 14th month, let’s hope that we can begin inoculating people faster, and get the millions of people in the most hard-hit industries (travel, restaurant, entertainment, hospitality) back to work — back to earning income and spending money again. When that happens, we’ll likely see another sustained surge in demand, caused by another significant shift in demand, shift in drivers, and shift in network design by shippers, brokers, and carriers of all sizes. We’ll keep sharing our data and insights.
About the data: Tucker Company Worldwide, Inc., and QualifiedCarriers.com have been capturing and analyzing FMCSA data, alongside many other monthly data points, since the beginning of 2012. The data is filtered to show only for-hire fleets that are active on the date the data is captured, and that have active authority and insurance on the FMCSA’s licensing and insurance database on that date. The filtered data seeks to count and represent all for-hire carriers that could conceivably be hired to move freight on the day of the data pull. Driver counts often lag a few months, as they are dependent on a number of variables including motor carrier census data. Motor carrier data is close to real-time, due to the nature of collection methods.