2018 was a wild ride. We experienced the implementation of ELDs, the introduction of strict compliance fees from retailers, and an influx of well-meaning but disconnected technology. Despite the market conditions (or as a result of them), the number of carriers continued to grow throughout 2018.

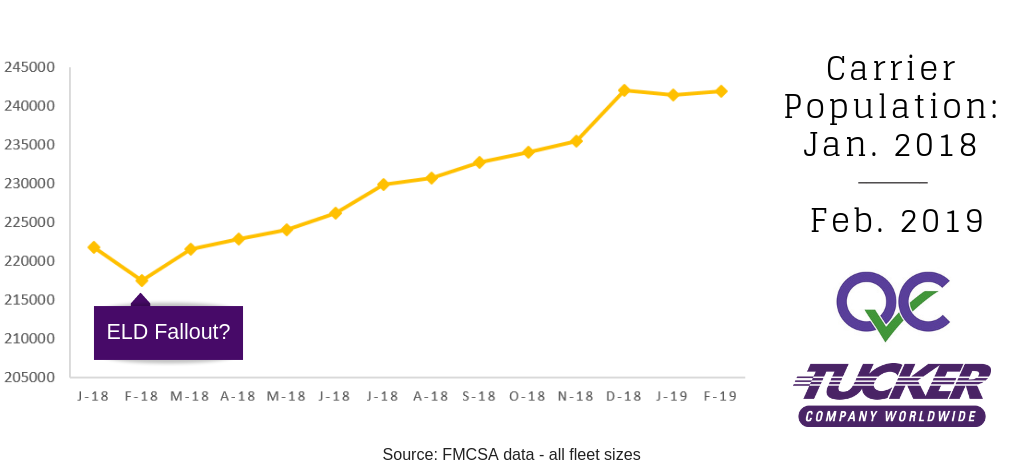
The data shows a dip right around February. If you remember, although ELDs went into effect in December, they were not fully enforced until April 1st. We suspect that the decline may reflect a number of carriers that decided to get out of the business rather than comply.
Regardless, as peak season reared its head, March saw a return to January's numbers, and only increased from there. As the year went on, and the spot market increased, so did the number of carriers in operation.
To put it into perspective, 14,674 carriers entered the marketplace in 2018, versus 12,232 the year prior. In a year where headlines screamed consolidation, driver shortages, and carrier attrition due to the implementation of ELDs, a 20% increase in the carrier pool is certainly at odds with the popular narratives.
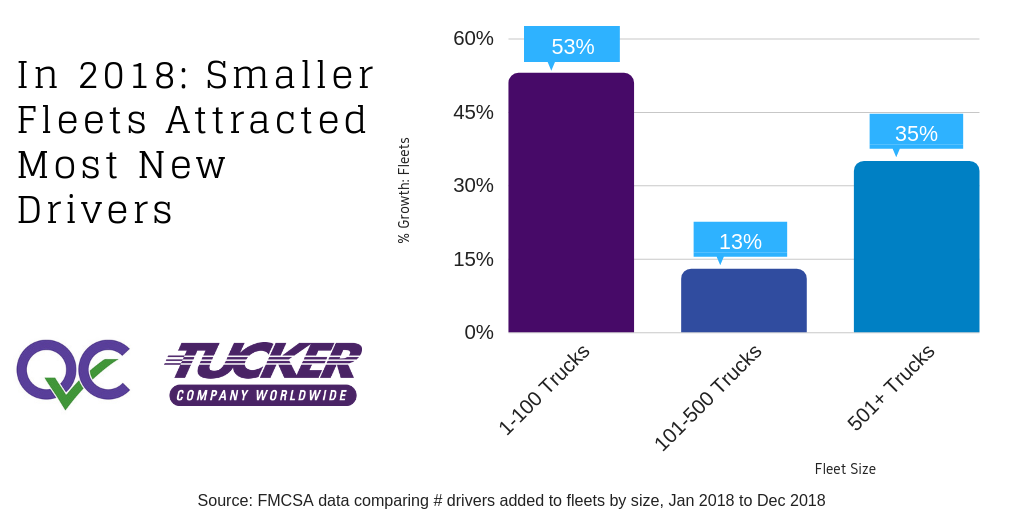
The freight industry also added over 107,000 drivers in 2018. Here's a snapshot of where they filtered into the carrier pool:

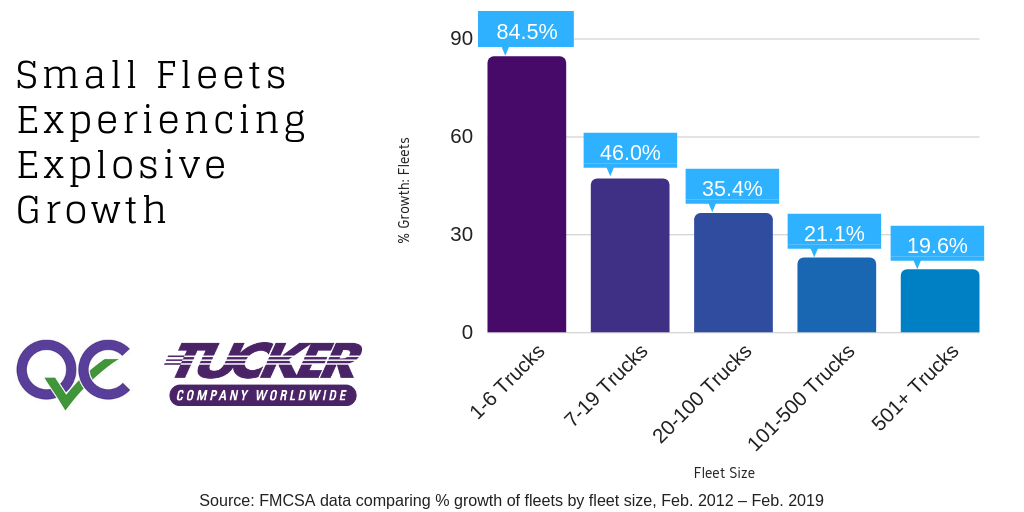
With January and February's numbers incorporated, here's an updated snapshot of how each fleet size has grown since 2012:

The first quarter of 2019 saw much less freight falling to the spot market, and the carrier population showed a small decline. Is this a blip on the radar, or is the carrier data signaling an inflection point? With more drivers striking out on their own last year, only time will tell if they can find enough freight to be successful. The technological tools that were introduced into the marketplace should certainly help them understand market trends, connect with shippers, and price effectively.
As a freight broker, we continue to monitor these trends in the freight market to better serve and educate our customers.
